Visualizing data with Gnuplot
On my pursuade for a tool to visualize simple list values I found gnuplot:
from Wikipedia:
gnuplot is a command-line program that can generate two- and three-dimensional plots of functions, data, and data fits.
I will focus on the capabilities of gnuplot on two-dimensional plots and in special howto visualize data without a corresponding second data value. But first here is the idea why I needed such a tool:
For one of my next posts I gather battery stats, in special the milliwatts of my laptop battery before and after some tweaks. I gather the stats in a simple file, one line one value. So, basically I already have all the data and I could simply present them. But pure data is considered as boring (what is true) and on top of that a picture paints a thousend words.
I could have simply paste the data into a LibreOffice Spreadsheed and create a diagram but that would be a) to easy and b) not realy feasible to do in a script
So I searched the internet for a free tool for this task. And found gnuplot. Gnuplot is very easy to install on an Ubuntu system (just check your synaptic or the software center) and needs zero configuration on the first hand. (Download for all other OS)
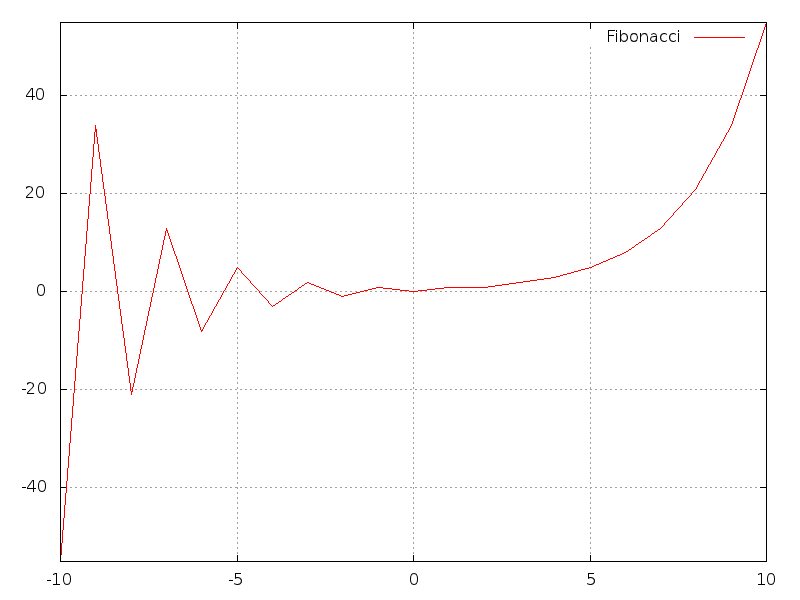
To create your first plot from a data file (fibonacci) you have to start gnuplot on the terminal with
gnuplot
you will get a window with the following output:
gnuplot>
now you could start with the plot right away, but we will set some configurations first hand:
row=-11
set yrange[-55:55]
set xrange[-10:10]
set term png size 800,600
set output "file.png"
set grid
plot "fibonacci.csv" using (row,row=row+1):1 title 'Fibonacci' with lines
this should give a picture like this:
What did all the lines of code mean?
set yrange[-55:55]
set the range of the y-axis from -55 (at the bottom) to 55 (at the top). xrange works similar but for the x-axis. If yrange[] and/or xrange[] is not given, gnuplot assumes fitting values.
set grid
activates the grid in the background. This is deactivated by default
set term png size 800,600
set output "file.png"
These lines tell gnuplot not to show the picture directly but to send it in a file as a png document
plot "fibonacci.csv" using (row,row=row+1):1 title 'Fibonacci' with lines
This is where the magic happens: “plot” is the actual command to plot the image. With the parameter “fibonacci.csv” gnuplot tries to get the values from a file rather than a function (like sin(x) or cos(x)… ) and the following construct tells gnuplot which values it has to use
row=-11
... (row,row=row+1):1 ...
Usualy gnuplot draws one dot for a given x/y-value. So we need two values. But in our file is only one value, the fibonacci-number (our y-value). One way to get rid of that problem would be to include a x-value in the file as well. But with the help of black magic (and variables) we can do it (in this case) without a second column.
row=-11
Initializes a variable with the value -11. In the plot command we can use this variable for our x-value. In that case our command would be
plot "fibonacci.csv" using row:1 title 'Fibonacci' with lines
But that would be problematic: As long as row equals -11 the x-value for every plot-point would be -11! So we have to build a combined argument “(row,row=row+1)” as x value. It’s best to read as “use row as x-value, then increment row by one”. After the combined command has to follow a colon and the y-value. That would be “1” Attention: “1” refers to the first column, not the value 1!
et voilà! The graph is done.
I’ve found plenty of ressources on the web (and so will you, if you google it) but this site helped me especially: