Improve energy consumption with Ubuntu and Lenovo IdeaPad Z370 (sandy bridge-chipset)
Update 2015-03-15: As Antiplex mentioned in the comments, the resources are slighlty out of date. An update is pending
I use my laptop (Lenovo Z370, with Ubuntu 11.10) a lot in the college. Unfortunatly there aren’t enough plugs in the wall for all students and I’m not willing to bring a plug board with me every time. So my approach to the problem was to improve the energy consumption of my laptop. I already had an energy plan with display dimming after two minutes and deactivate bluetooth by default (I don’t have any bluetooth gadget, so why bother).
There are some rumors that Ubuntu 11.04 and 11.10 consume a lot more energy than the previous versions and slightly more than windows (see for example here). So I looked for a way to improve my battery life.
Down with the power consumption!
While I was google-ing I found this post (Linuxundich.de, German) in which the author suggested to use the “i915.i915_enable_rc6=1”-Kernel parameter (if you have a sandy bridge chipset). Based on his suggestions I made my own test cases and logged everything with a script.
I looked for some different Kernel-parameter setups to test and decided to test the default kernel parameter, the recommended kernel parameters and not reccommended but suggested kernel parameters:
1) quiet splash
2) quiet splash pcie_aspm=force acpi=noirq i915.i915_enable_rc6=1
3) quiet splash pcie_aspm=force acpi=noirq i915.i915_enable_rc6=1 i915.i915_enable_fbc=1 i915.lvds_downclock=1
A test
My target was to read the current power consumption from the battery every five seconds and save this in a file for later analysis. Here is my test setup: (test_setup) It’s my typical college idle setup. Thunderbird, dropbox, Firefox with facebook and so on.
Scripting and gnuplot
With my script (it’s here battery_log) I was able to read the current consumption and write it in a file. Afterwards the script generated a chart with the command line tool gnuplot (here my article about gnuplot). The chart looked like this:
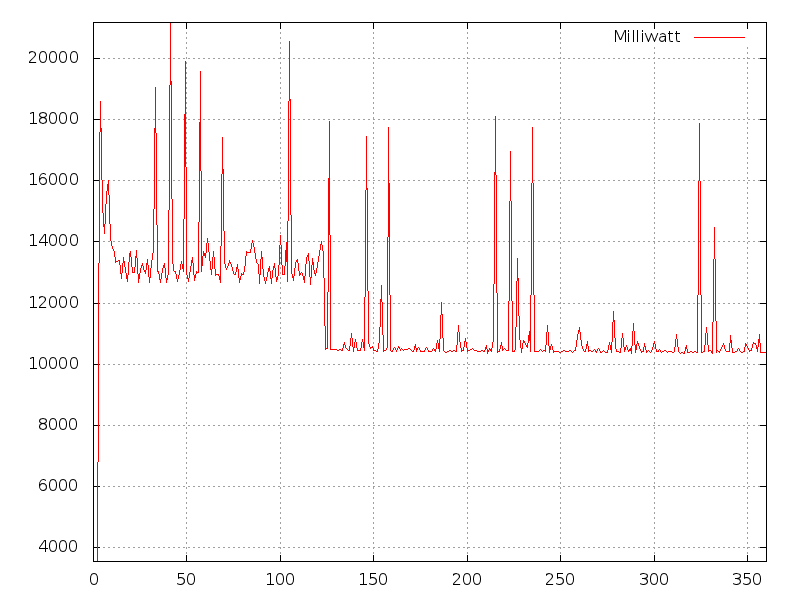
After the third graph I created another one, based on the three logfiles for comparison. (The source files and gnuplot commandfiles are at the bottom, in a zip file).
The new combined graph looked very interesting, because you could see the difference between the three parameters clearly:
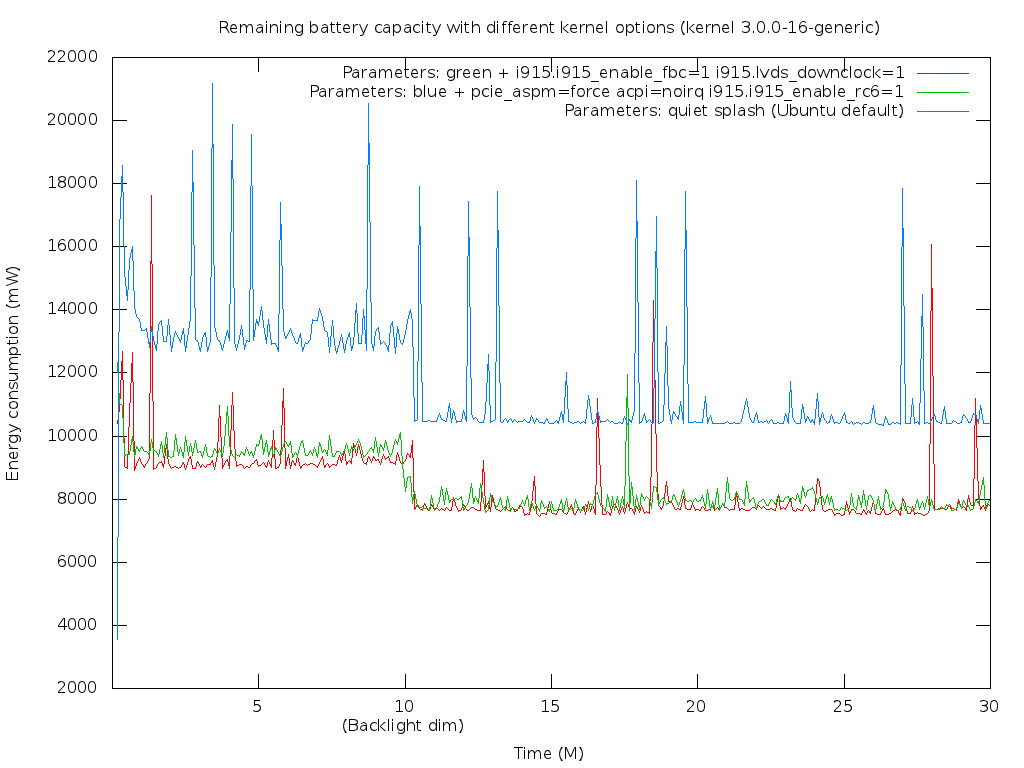
By default my laptop used around 13 Watt with backlight lit and around 11 Watt when backlight is off. With the new Kernel-Parameter the usage went down to around 9 Watt with backlight and 7,5 without. So, It’d be clever to use one of the kernel-parameter sets. But which one?
Who is the fairest of them all?
You can easily distinguish the two sets, by their middlevalue and amplitudes: The green line is a little bit higher than the red one on average but the red one has higher amplitudes… So which on used the least amount of energy? With which set does my battery last the longest?
To answer that question I modificated my script (see in the zip files) and read the remaining battery capacity every 5 seconds till the laptop shut down because of low energy. I did this again three times, one for every set of parameters with the same test_setup as above (obiviously the laptop was loaded every time before the test).
Again a made a graph:

Battery life with different set of kernel-parameter:
1) 3 hours, ten minutes (100 %) 2) 5 hours (158 %) 3) 5 hours, ten minutes (163 %)
Conclusion:
I will use the set 3) because of the bonus battery life. In the aforementioned post the authos spoke about grafic-glitches, but they didn’t happen to me so everything is fine. I would suggest that everyone with a sandy bridge chipset at least give it a try.
Links:
battery_capacity_log, battery_log (all my files from the test) linuxundich.de (gave me teh initial idea) williambrownstreet.net (some additional information) stackoverflow.com (how to intepret the battery file in linux)